Reflections on the summer weather: What does our weather station data tell us?
In this seasonal summary of our weather station data we consider the weather events during Summer 2022, including an insight in to the two heat waves that occurred in June and August.
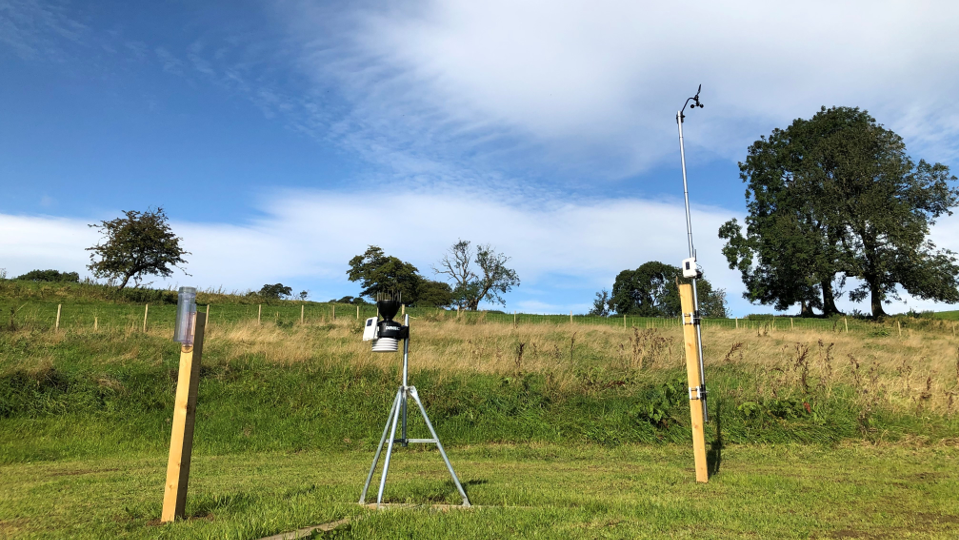
We installed a weather station at our Broughton Park office near Skipton in North Yorkshire in 2019. It allows real time weather information to be monitored and enables the collection of historical meteorological data which is freely available for educational and research use.
Summer 2022 seasonal summary
 Heather Forbes, Flood Risk Science Analyst at JBA Consulting
There’s been a chill to the air in the last few weeks here in Skipton, and with Autumn upon us it seemed like the perfect time to assess our weather station records from the past season.
Of course, the stand-out event of the season was the heatwave in July, when the temperature at Broughton Park reached 38.5C in the afternoon. Following a brief respite, with temperatures dropping to the ‘cool’ low twenties, we then had a rise in temperatures in mid-August, though this time reaching a much more manageable high of 31C.
There was a distinct fall in temperatures from mid-September. The last date that temperatures were above 20C was 13 September, and by 17 September we had our first air frost! This is significantly earlier than last year, when this didn’t occur until 4 November.
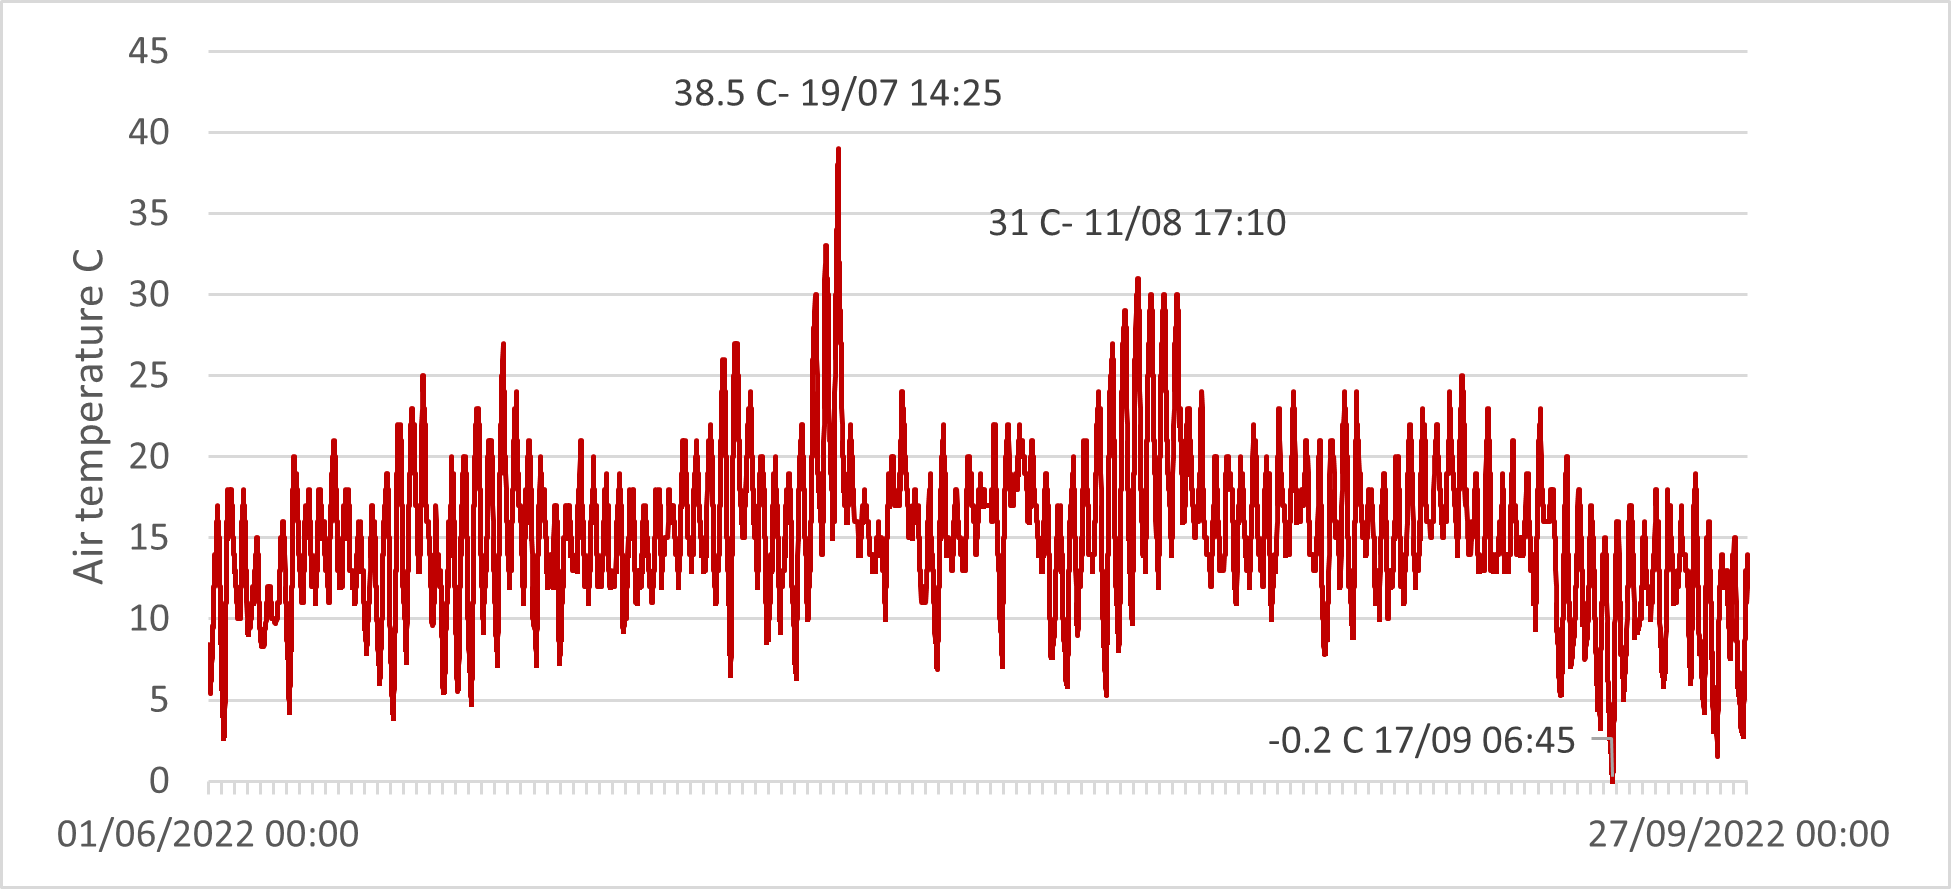
Figure 2.1: 5-minute air temperature recorded by the JBA Trust weather station at Broughton Park, 1 June to 27 September 2022
Overall, the summer of 2022 has been a notoriously dry one for the UK, but was this also the case at Broughton Park? A comparison against the seasonal rainfall accumulation from last year suggests not – this year we’ve had 142.8mm between 1 June and 31 August, whilst last year saw 164.2mm in the same period. Much of this year’s summer rainfall was from one event on 9 June when we had 33mm of rainfall, the majority of which fell between 1am and 3am from heavy showers and thunderstorms brought by a low pressure system.
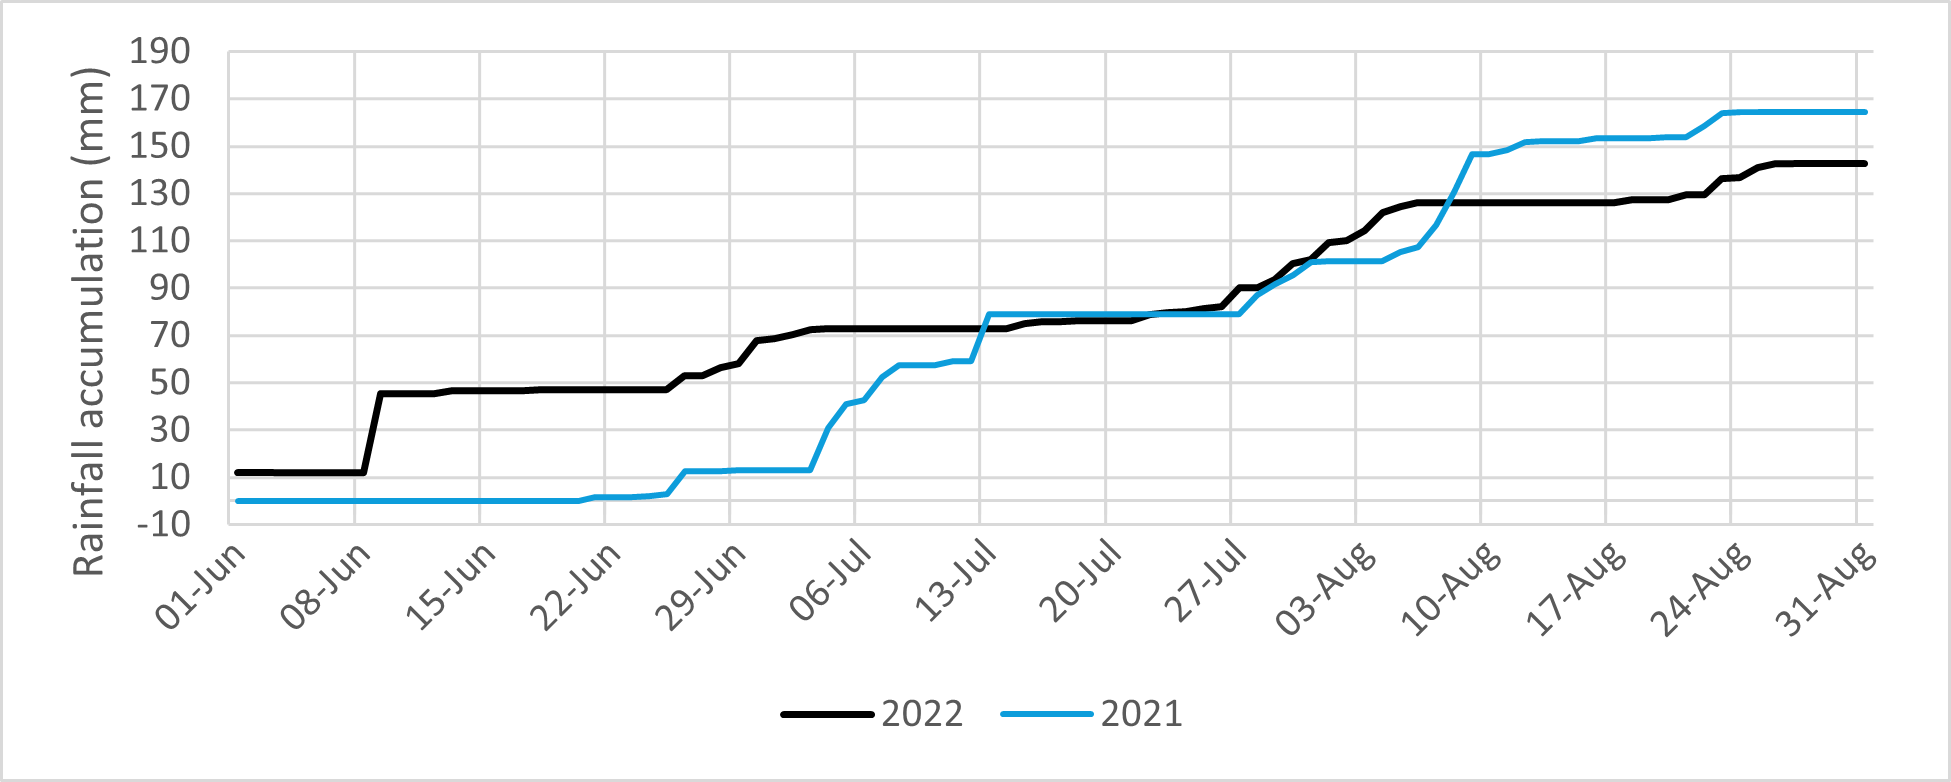
Figure 2.2: Seasonal rainfall accumulation recorded by the JBA Trust weather station from June to August 2022
As well as seasonal climatology, the weather station also allows us to look at the small-scale processes that affect our weather daily. During the second heat wave in August, it was interesting to see the diurnal (daily) cycle in temperatures and wind speed, as shown in the graph below. There was a classic cycle of winds increasing during the day in response to convective mixing, and lower (or even zero) wind speeds at night indicating the presence of a nocturnal temperature inversion.
Also note how quickly the temperatures started to rise in the morning as the sun hit the ground and started heating through the inversion. Ahead of the first heatwave we also saw strengthening southerly winds bringing in the warm, continental air.
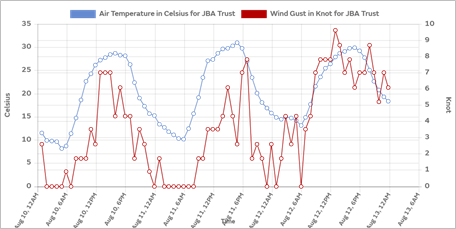
Figure 2.3: Air temperature and wind gust recorded by the JBA Trust weather station, 10-12 August 2022
Further information
If you are interested to see what conditions the upcoming winter season will bring, then you can follow the weather in real-time on our weather station dashboard. You can also find accompanying learning resources and plenty of information about the weather station and other projects. For explanations of what happens in heatwaves, high pressure and all sorts of weather we would recommend checking out the ‘Learn about’ pages of the Met Office.