Interactive map: Areas of potential for nature-based flood risk management
The map was created in 2018 to show areas where different types of river and catchment management approaches have the potential to help reduce flood risk by working with nature.
It also shows information about nature-based flood risk management projects, including natural flood management (NFM), to help build up a picture of what is being done across the UK.
What data is shown in the maps?
The map currently shows three main data sets:
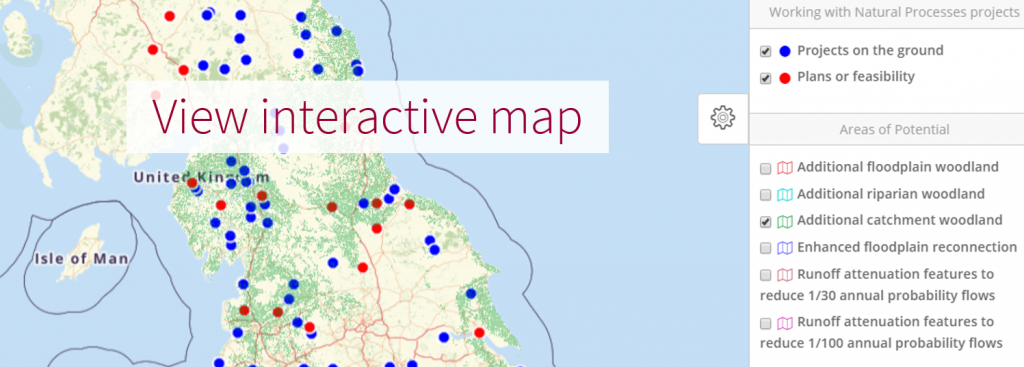
1. Areas of Potential
This set of map layers show areas where different types of river and catchment management approaches have the potential to help reduce flood risk by working with nature. The data is based on Defra, Environment Agency and Natural Resources Wales research published here. The ‘Areas of Potential’ are accompanied by a user guide and technical report. The data sets shown in the maps can be found at www.data.gov.uk by searching for the term “WWNP”.
2. Project Catalogue
These points show information about projects where the working with natural processes (WwNP) approach has been applied on the ground, or considered as an option, to help reduce flood risk. This approach is also known as natural flood management (NFM).
Please note, the project catalogue was last updated in 2018 and has now been superseded by the national projects maps available on the NFM Hub an created and maintained by CaBA (Catchment Based Approach): Progress Dashboard | NFM Monitoring and Evaluation
3. Flood Maps
The flood maps are based on Environment Agency data about the risk of flooding in England and past floods. The data sets shown in the maps can be found at www.data.gov.uk.
About the maps
The Areas of Potential shown on the map are based on national data sets and models, so they should not be relied on for detailed planning, but they give an indication of the types of land management measures that could be considered.
The maps are provided as a research resource and we cannot make definitive statements about the accuracy of the information they contain. In particular, we know that some of the information could go out of date, or that there may be relevant data points we are not aware of.
The evidence base
The concept of green infrastructure – working with natural processes – is gaining increasing currency as part of portfolio of strategies to reduce the risk of the kind of devastating floods that have hit the UK over recent years.
The project catalogue was created in 2018 and identifies over 130 schemes using over 50 different flood prevention measures, including schemes that are still at the feasibility and modelling stage.
The performance of some schemes was found not to be monitored. Where they are being assessed, mostly this is through qualitative assessment with less than a third using quantitative monitoring techniques. So while there is clear evidence that the schemes have environmental benefits such as encouraging biodiversity, less is generally known about their impact on flood protection.
“Nature-based schemes are attractive due to their likelihood of having lower upfront costs compared to ‘hard engineering’, their potential to create multiple ecosystem benefits and their scale of deployment, which may help to stimulate or encourage community involvement,” said Dr Barry Hankin, from JBA Consulting, who oversaw the mapping project and is closely involved in research on natural flood management.
But the problem is that it is difficult to keep track of what schemes exist in the UK, let alone how well they work.
“There remains a need to gather evidence about the benefits, costs, implementation and long-term performance of nature-based approaches for flood mitigation” says Rob Lamb, Managing Director of the JBA Trust and a Professor in Practice at Lancaster Environment Centre. “We should know what has been done and the scale of the benefits to help understand how many resources to commit into schemes like these. Our primary aim in creating the map was to begin identifying how the performance of the projects is being assessed, so that we can build a picture of how working with natural processes delivers benefits at a broader scale, and how much is known about those benefits.”
“The mapping resources we have created are just a small first step, an information resource for researchers and ultimately for other interested parties including government agencies, local authorities and river catchment managers. We hope it will provoke thought about how to gather the necessary evidence to evaluate the contribution of green infrastructure to flood management,” Rob explains.
Acknowledgements
We identified over 130 schemes and have approached all of the implementing organisations for details of those schemes included in the catalogue and would like to thank all those who responded.
We thank the Environment Agency for permission to use their databases.
We would also like to thank Duncan Nicholls and Emily Christopherson, who helped to research and collate the project information, and to create the interactive map based catalogue, while working with us during internship placements. You can learn more about how the map based catalogue was developed in Duncan’s blog and find out more about how the catalogue was updated in Emily’s blog.
Woodland opportunity maps, Working with nature maps, WWN, Natural flood management (NFM) maps, runoff attenuation features RAFS maps, flood risk maps, NFM projects, NFM opportunity maps, nature based flood risk management, floodplain woodland opportunity potential maps, riparian woodland opportunity potential maps, catchment woodland opportunity potential maps, NFM Natural Flood Management, NFM data, leaky dams,